Monitor
The Engine Cockpit allows you to monitor your Axon Ivy Engine.
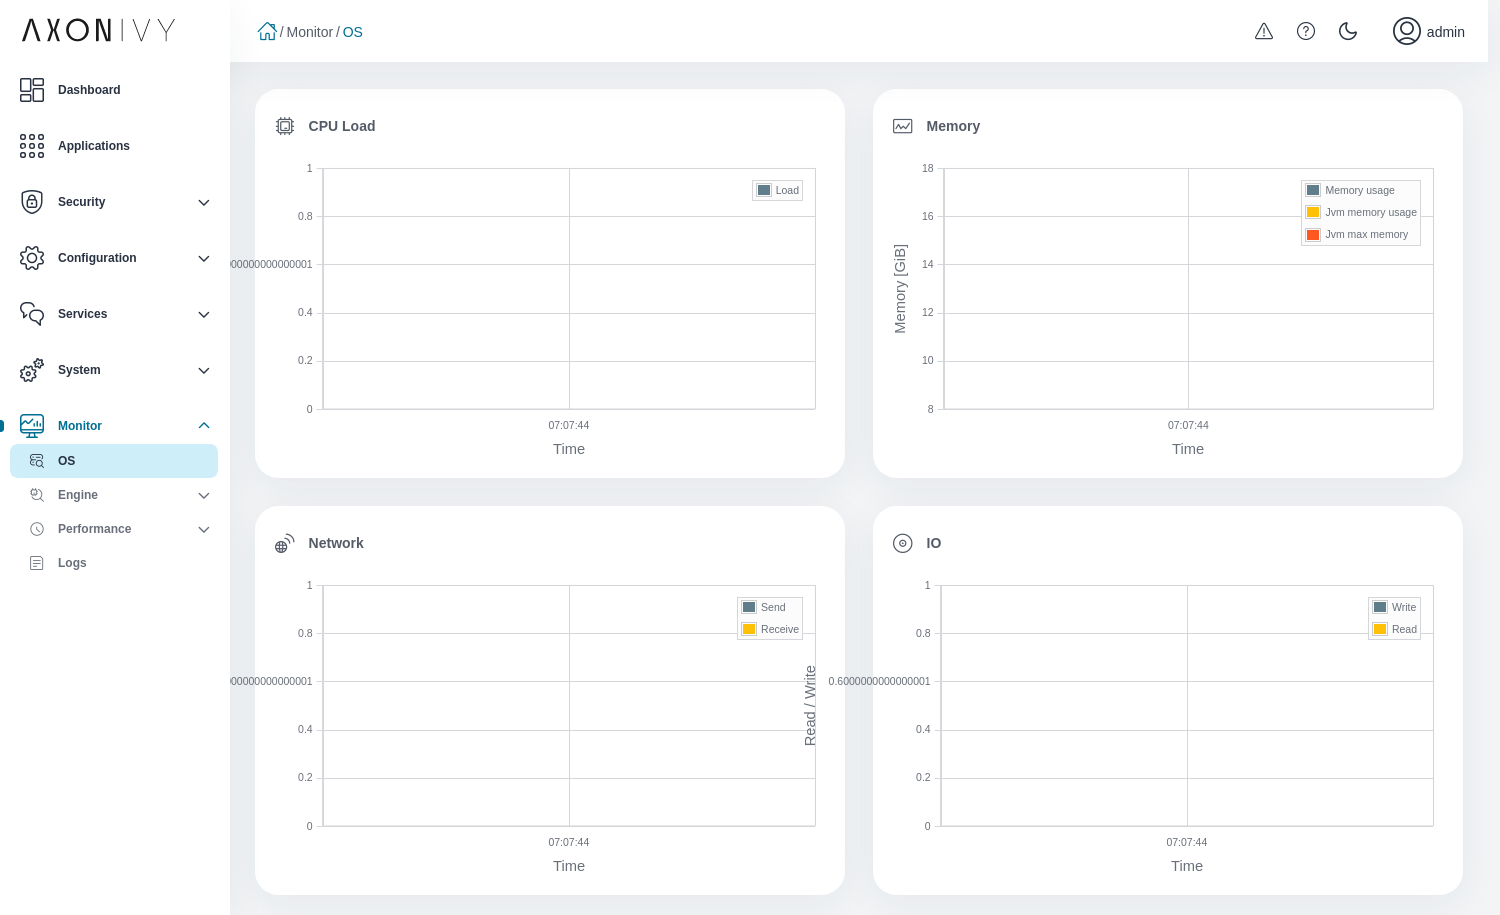
OS
The OS page shows an overview of the CPU load, memory load, network traffic and disk read-write activity. Additionally, the memory monitor displays the max and current memory usage of the JVM.
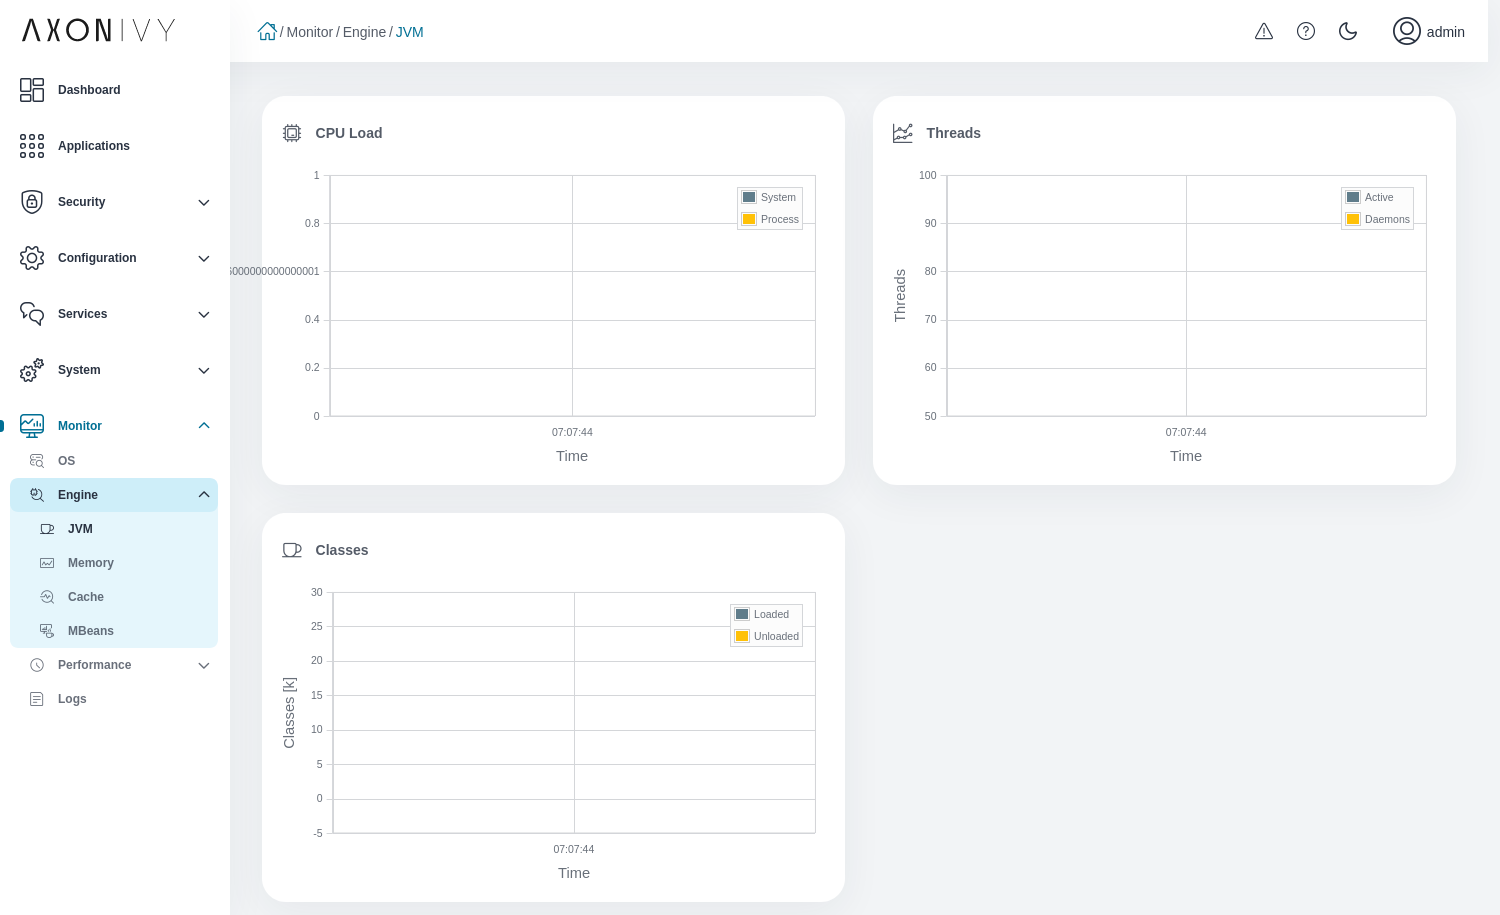
Engine
The Engine pages allows you to monitor some critical indicators of your Axon Ivy Engine:
JVM: CPU load, number of threads, loaded and unloaded classes.
Memory: Heap and non heap memory, garbage collections time.
Cache: System database caches and their metrics
MBeans: Java Management Extensions (JMX) MBeans viewer
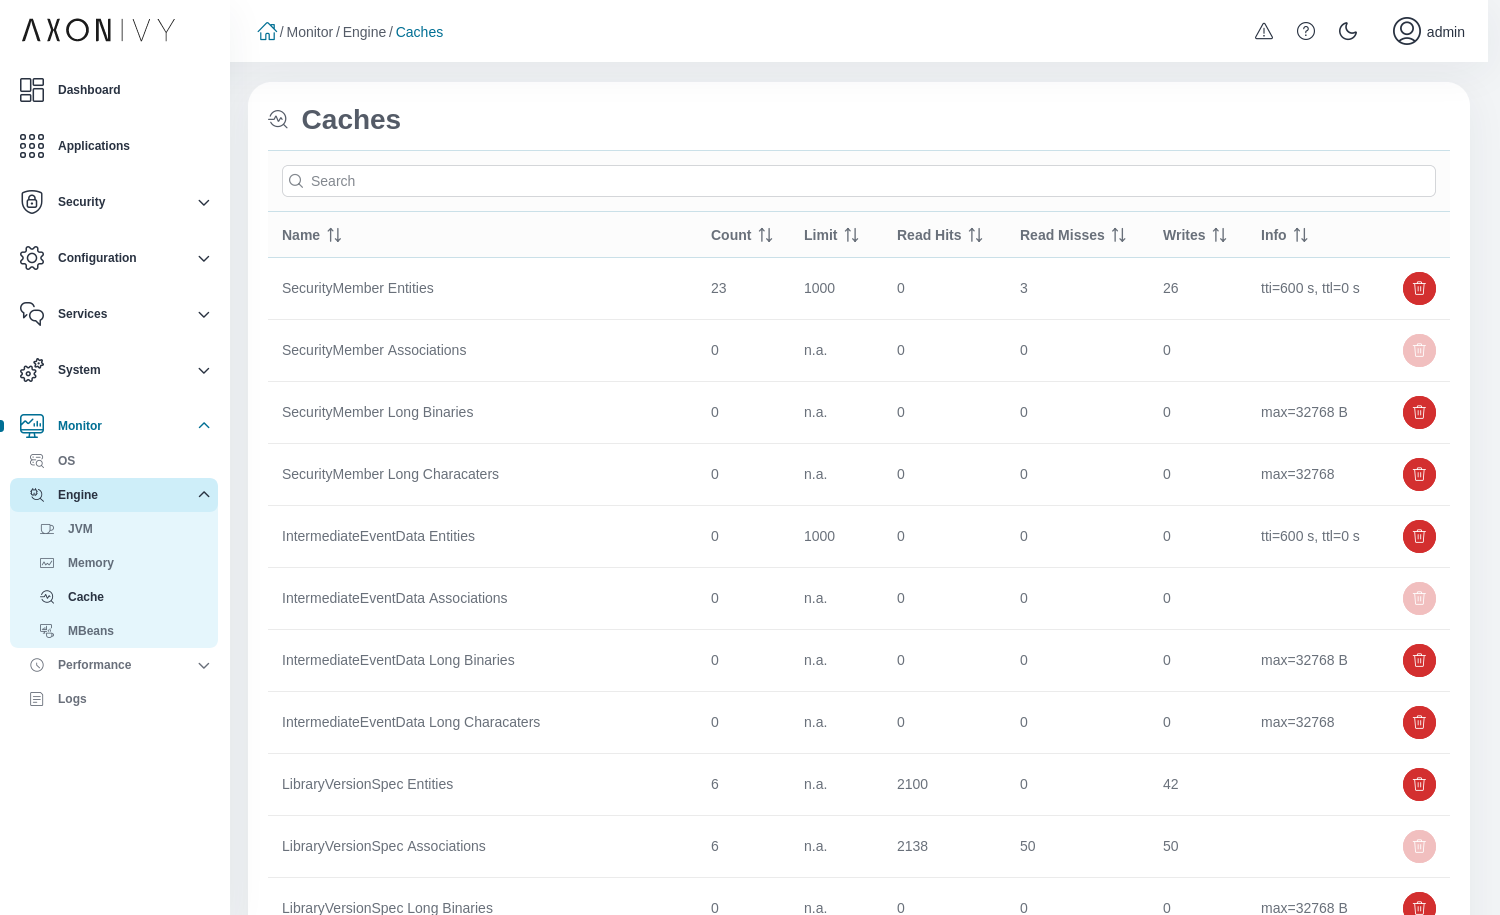
Cache
The Cache view displays a table with all system database caches and their metrics. The caches reduce the number of system database read accesses.
Increasing the amount of data that is cached may help solve performance problems. You should try to increase the cache limits if you have a lot of read misses and the number of cached entities are near the limit or above. If this is the case, the number of both corresponding columns are displayed in red. The cache limits can be configured in the ivy.yaml file.
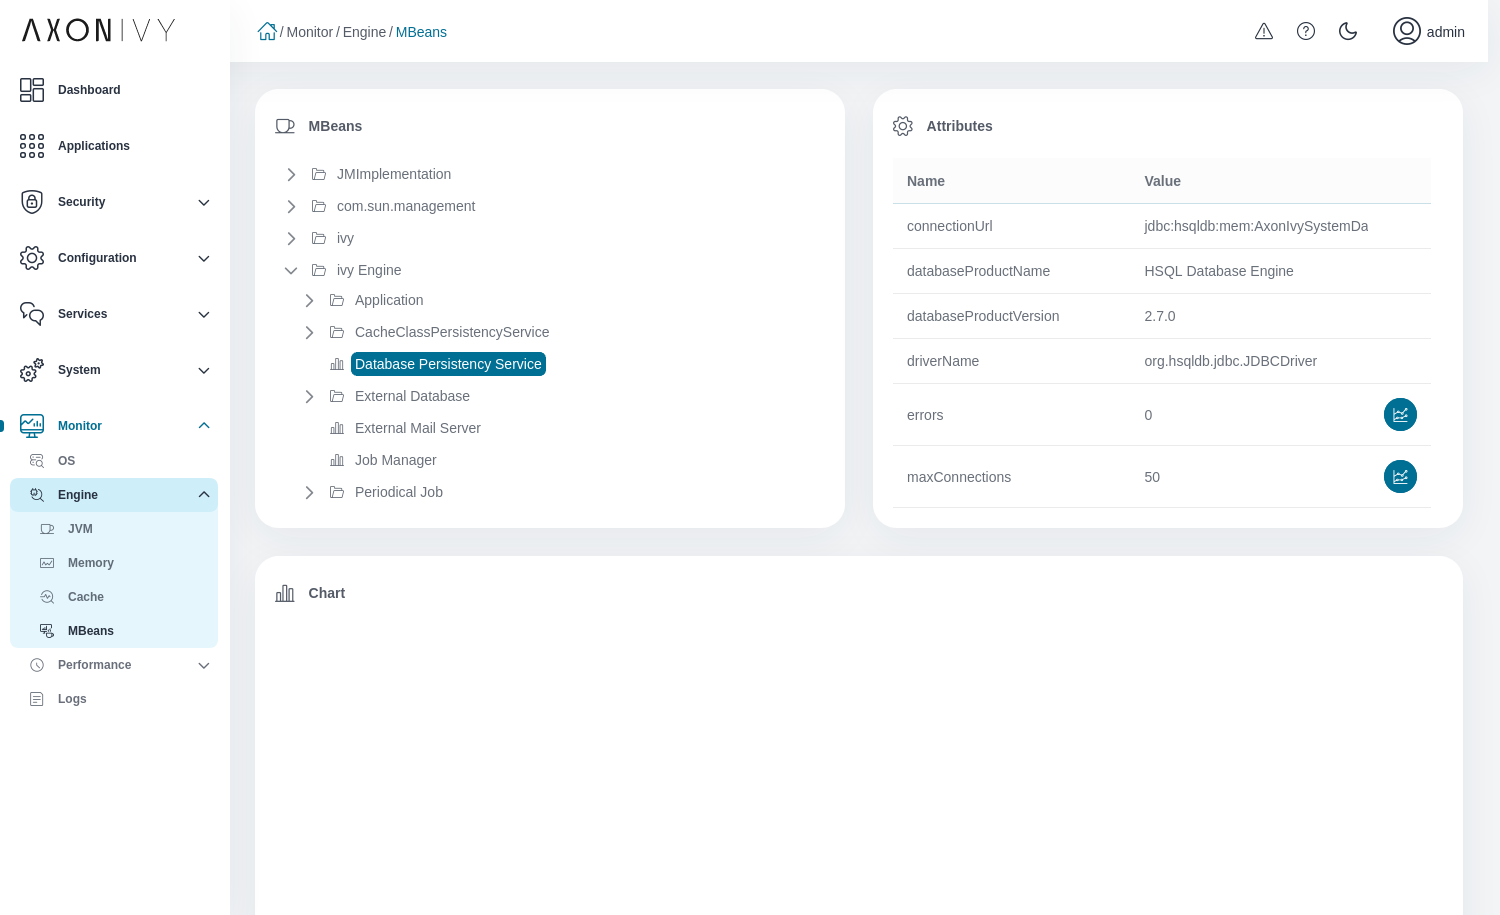
MBeans
The MBeans view displays a tree with all engine Java Management Extensions (JMX) MBeans. Click on one of the MBeans to see all of its attributes. Click on an attribute with numeric values to display the value of the attribute over time in a chart. You can add multiple attributes to the chart. Click on the remove icon in the table below the chart to remove the attribute from the chart.
Performance
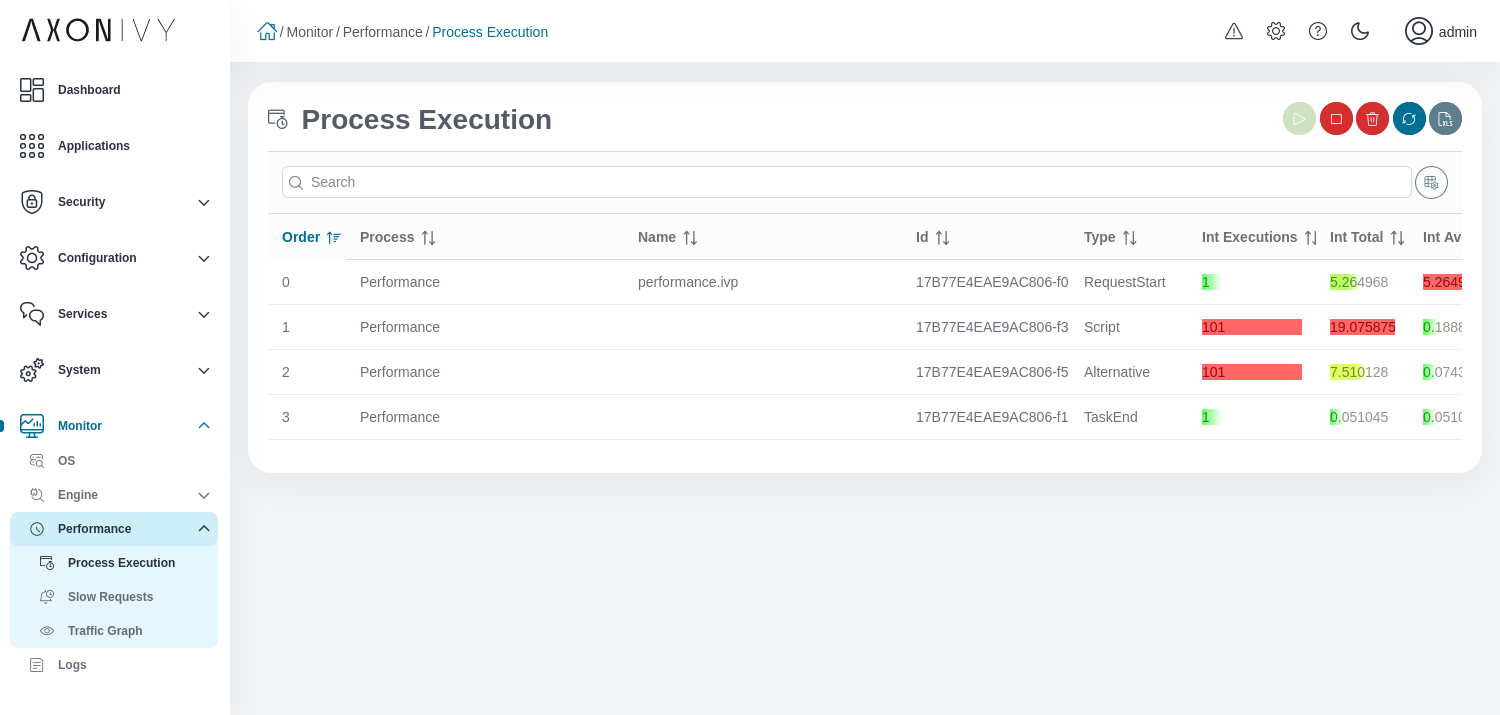
Process Execution
The Process Execution view allows you to activate and analyze the Process Element Performance statistic.
You can start, stop, clear or refresh the statistic, or export it to an Excel file. Note: by default not all available columns are shown. Use the configure columns button right to the search box to show or hide the columns.
If you want to configure that the statistic is written periodically to a CSV Statistics File use the configuration icon left to the help button it will take you directly to the corresponding settings in the System Configuration.
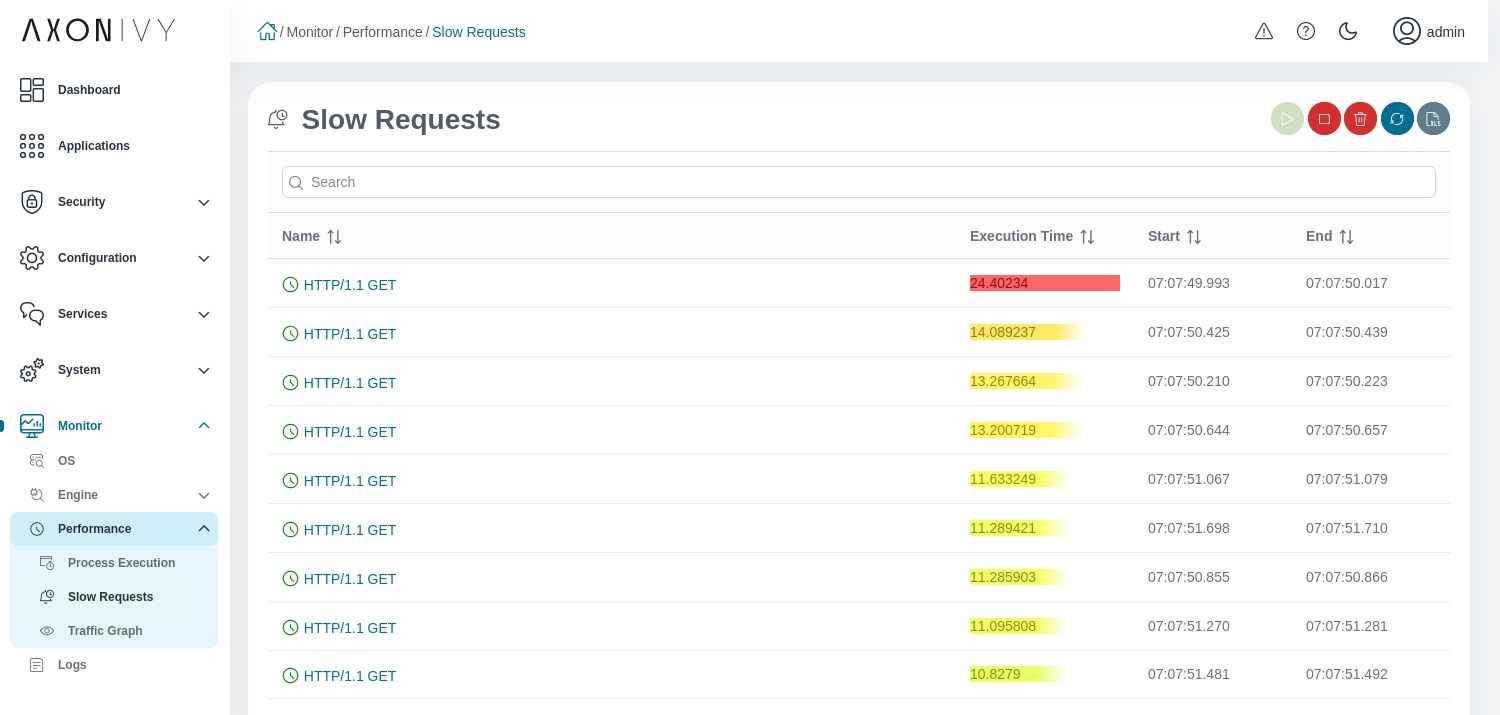
Slow Requests
The Slow Requests view allows you to activate and analyze the Request Tracing. If activated every request is traced. The fifty slowest requests will be displayed in this view.
You can start, stop, clear or refresh the tracing or export it to an Excel file. Hover with the mouse on the name to see additional attributes of the request. You can click on a request to see where the time of the request was spent (e.g., on external calls to REST, SOAP service, databases etc.).
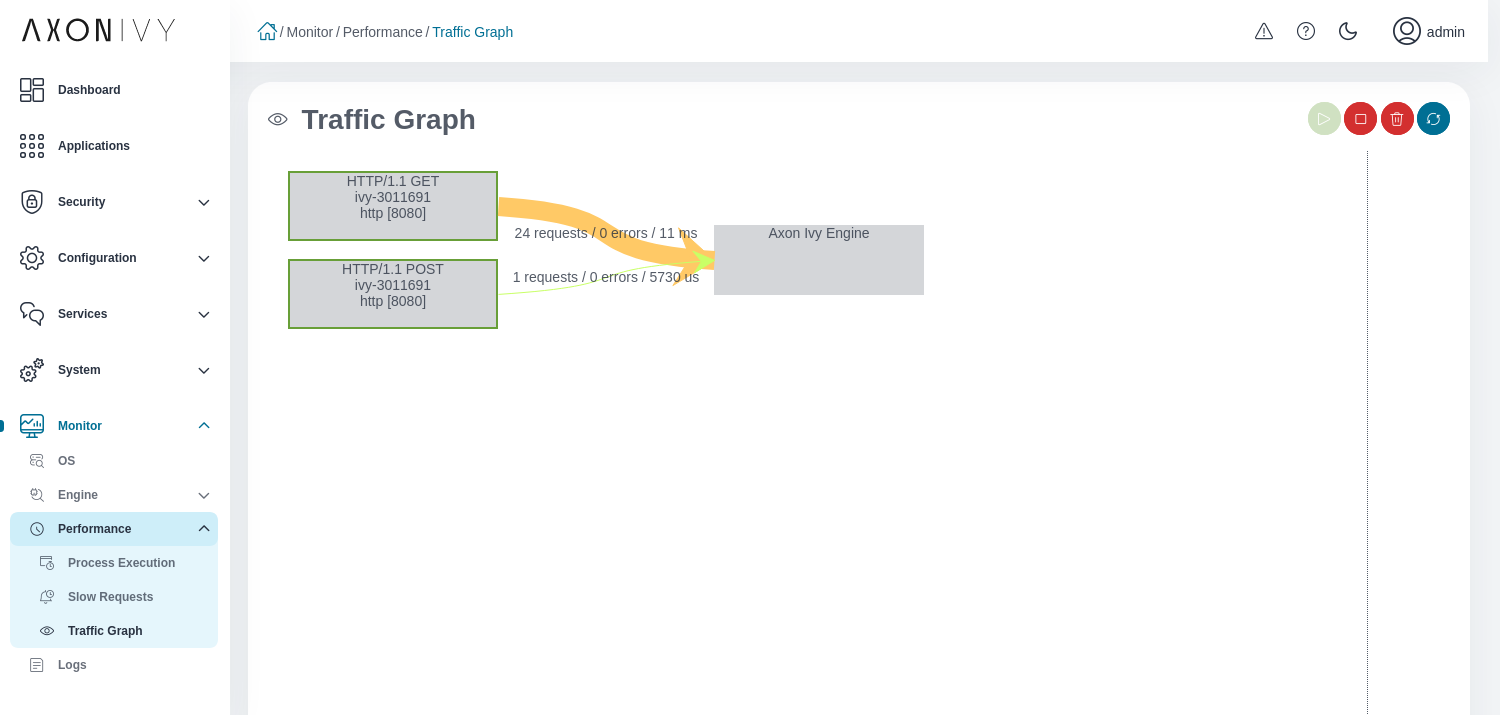
Traffic Graph
The Traffic Graph view gives you a quick overview of inbound and outbound communication channels to and from the Axon Ivy Engine. The more request a certain communication channel has the wider it is displayed. The color reflects the response times. Green means fast response times. Red means slow request times relative to the other communication channels. The color of the source or target of a communication link indicates if there are errors. Hover over source or target of a communication channel to get more detailed information. Like Slow Requests you have to activate Request Tracing to get useful data.
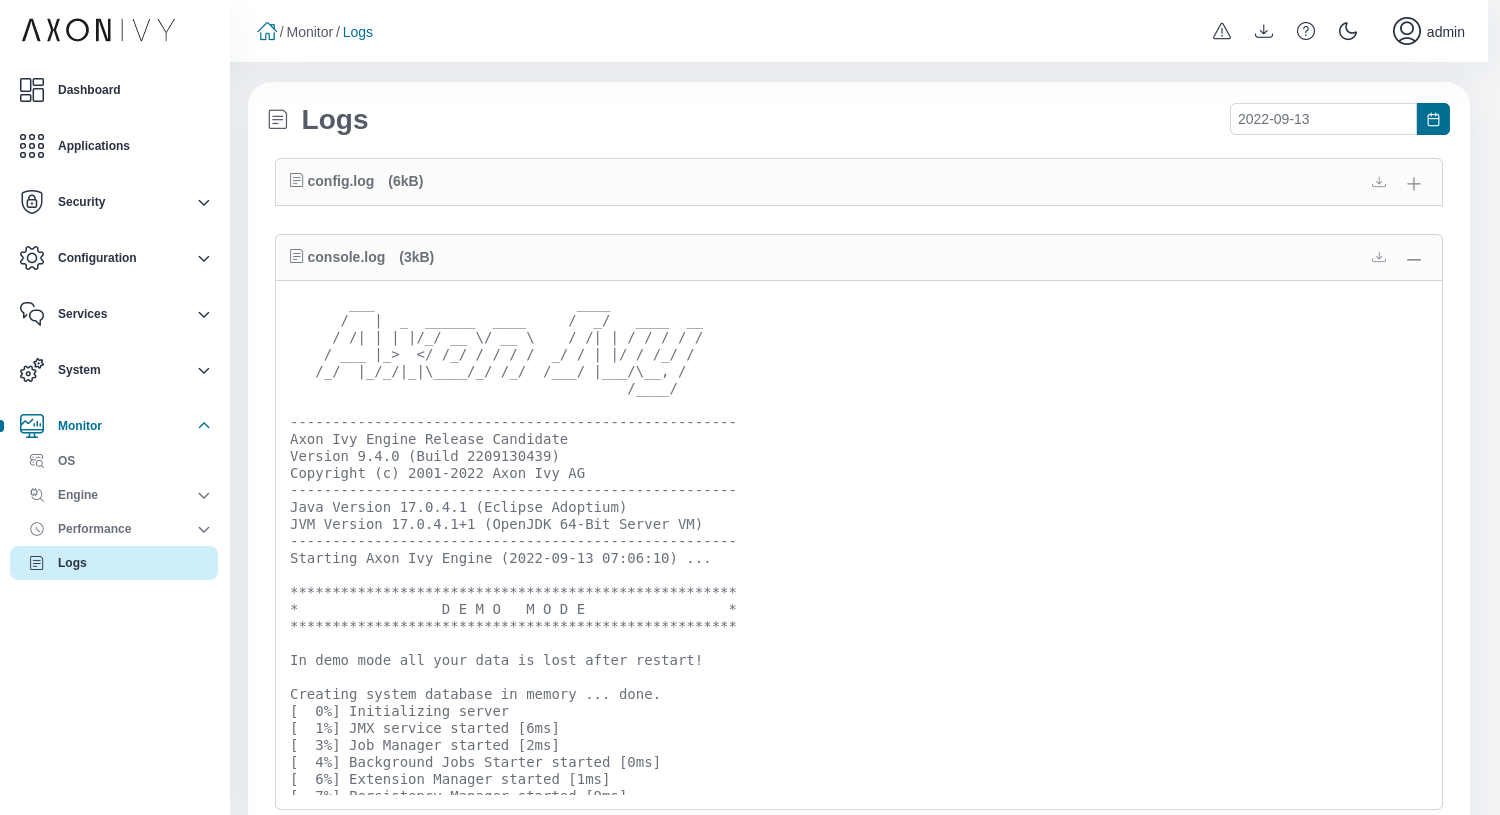
Logs
The logs view shows the current engine log files console.log,
config.log, deprecation.log, ivy.log and usersynch.log.
Click on + to show or - to hide the log file details. If you
want to look at the logs of an different day, you can change the date at the top right.
Services
The Services pages allows you to monitor some critical indicators of external services your Axon Ivy Engine communicates with:
Email: Number of mails sent, execution time to send mails.
System Database: Number of open and used connections, number of transactions and errors, transaction processing time.
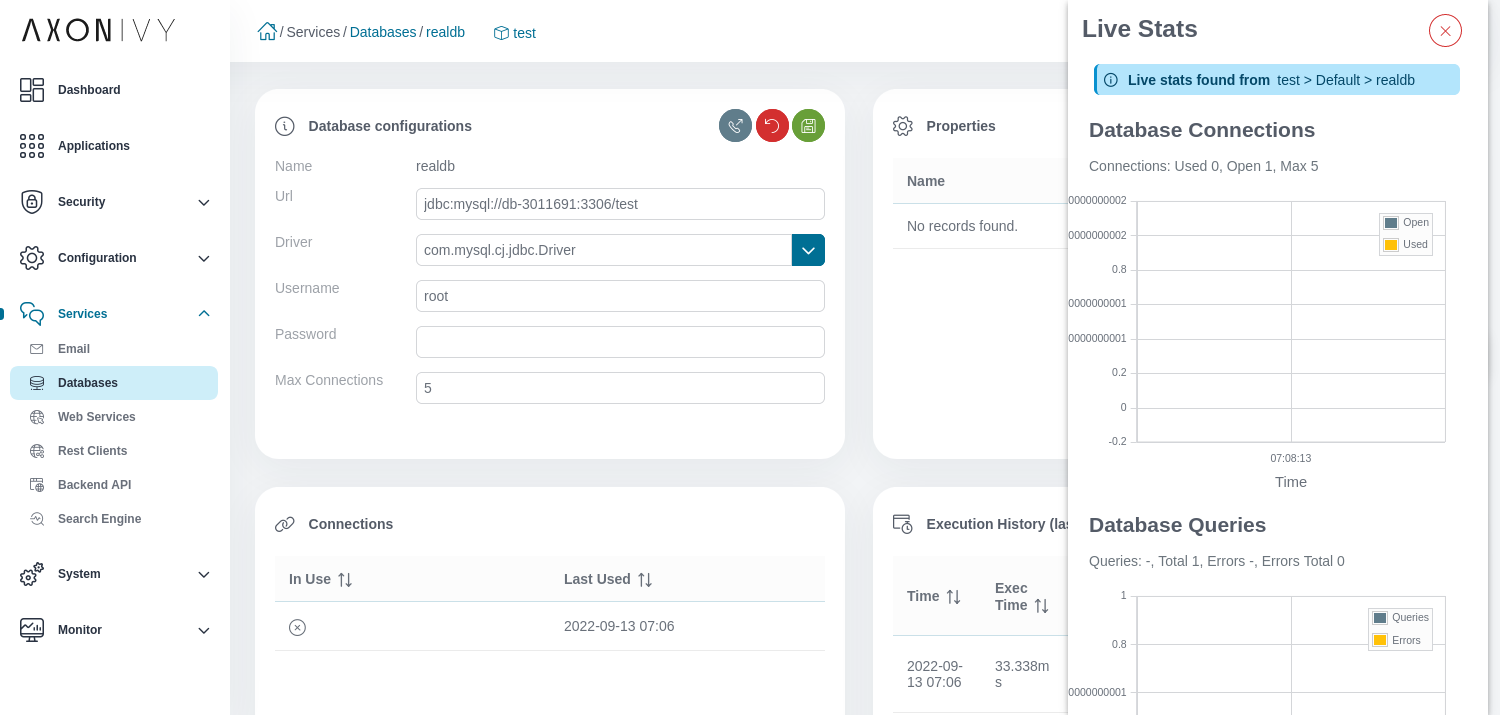
Databases: Number of open and used connections, number of queries and errors, query execution time of the selected database.
Web Services: Number of calls and errors, execution time of the selected web service.
REST Clients: Number of open and used connections, Number of calls and errors, execution time of the selected REST client.
You can open these life stats from the detailed view of the desired service using the monitor button at the right side.